
Following on from last week’s post, there’s a growing sense of worry in the US, and here in Australia, that the sharemarket is overvalued.
And after a ten year period of solid returns, with markets near record highs and growing tensions across the world, it’s not hard to see why many are worried.
The implication being, this cycle is running out of steam and it’s going to end pretty soon. Badly.
So is this true? And for those of you on the road to Financial Independence, what should you do about it? It’s an almighty topic, so let’s dive in!
First, you can pretty much ignore the term ‘record high’. Why?
For all the ups and downs, the sharemarket goes up over time. So this means shares are regularly hitting record highs! And that effectively renders the term meaningless.
Let’s say today is a record high – an imaginary value of 1000 points. Tomorrow the market is at 1001, another record high. Maybe a week later it’s at 1003 – holy shit, another record high!
As the sharemarket goes up over the next few decades, how many record highs do you think you’ll see? Exactly!
Ben Carlson outlines this perfectly in relation to the US market…
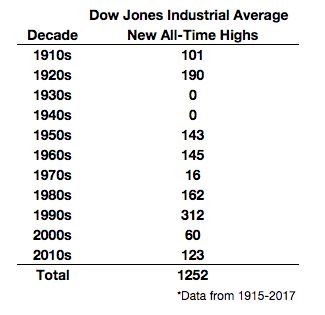
“Looking at over 100 years of data on the Dow going back to 1915, shows that stocks have had 1,252 highs. That works out to an average of about 12 new highs every year. Assuming the average investor is in the markets for 40 years, that would be almost 500 highs in a lifetime of investing in stocks.”
This table shows the number of highs by decade going back to 1915…
So why is the term ‘record high’ used all the time? Because it sounds like a big deal. And if it sounds like a big deal, it draws people’s attention. That’s why the media loves it, when crafting hysterical articles about the coming recession or impending market crash.
But the market being at a record high doesn’t actually mean anything. It doesn’t tell us whether it’s cheap or expensive. That might surprise you, but think about it this way.
If the market continues to rise to new highs, but company earnings are growing at a faster rate, then the market is not getting more expensive.
In fact, you could argue the market is getting cheaper. Because you’re buying each dollar of earnings for less than before, as measured by the price-to-earnings ratio. Let’s look at that now…
What is the price-to-earnings (PE) ratio?
Basically, the PE ratio tells us what price the market is trading at, in relation to its earnings. Put another way, how much it costs to buy one dollar of annual earnings.
Here’s a chart from the RBA earlier this year showing the history of PE ratios for Australia and the US.

For Australia, the market isn’t far from its long term average. The US looks expensive though. But take a second look at that chart. The US has been ‘overvalued’ a lot of the time since the early 90s, or most of the last 30 years. So perhaps something else is going on here? More on this later.
Back to Australia. This more recent chart shows valuations have crept higher this year. Although the second chart shows the dividend yield is right around average.
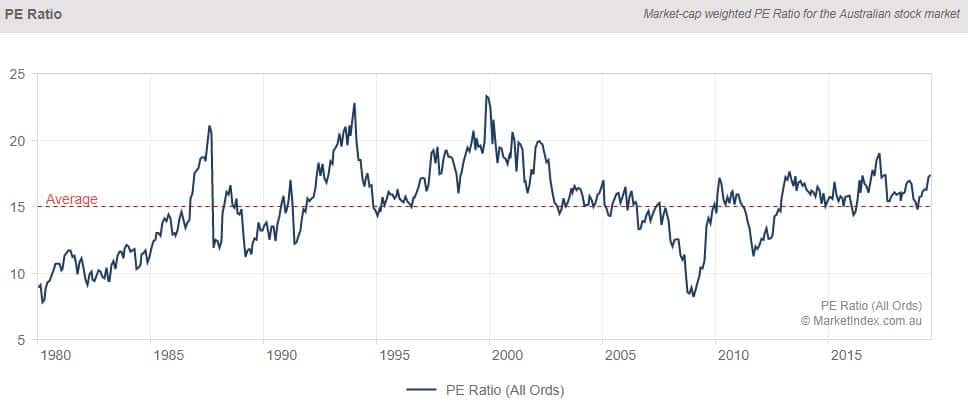
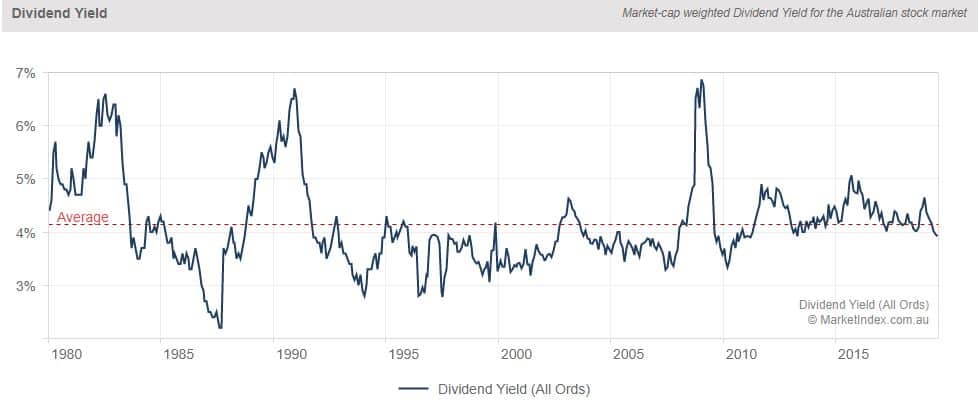
So you could probably argue that both markets are priced a little bit more richly than the long term average. And indeed, it gets a little scarier when looked at another way…
What is the CAPE ratio?
The CAPE ratio stands for the ‘cyclically-adjusted price-to-earnings’ ratio. Yep, it’s a mouthful! Created by Professor Robert Shiller, it’s often referred to as the Shiller PE.
In simple terms, it’s the price to average company earnings from the last ten years, adjusted for inflation. The goal is to smooth out the ups and downs in earnings and give a perhaps more accurate view of value.
In the US, it’s a popular way to measure valuations, as the CAPE ratio was very high right before the 2000 tech bubble crash, and also in 1929 in the great market boom before the Great Depression.
So what does this measure show right now?
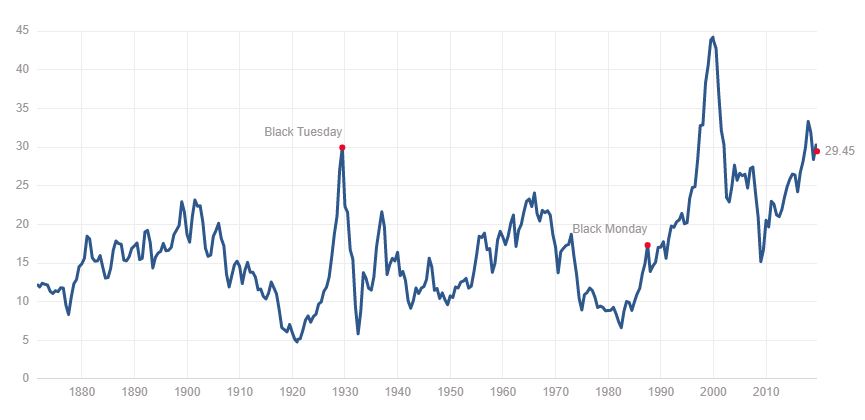
Yikes! Looks a little worrying to put it mildly! The market has only been this ‘expensive’ twice before in history. And neither of those occasions were exactly a great time to buy!
But again, it’s showing the market has appeared highly priced since the mid 90s. So if this was your bellweather, you’d likely have felt nervous investing for most of the last 25 years!
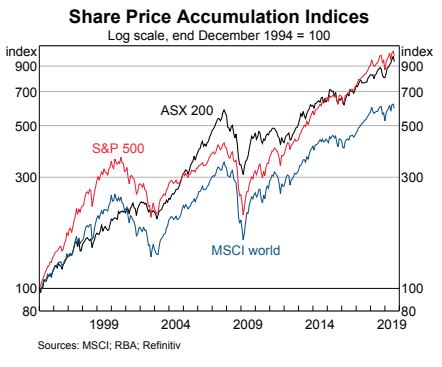
And as we know, returns have been very healthy…
So how useful is the CAPE ratio? Why is it so bearish? And is there an alternative way to help forecast long term returns?
I’ll declare my hand now. I’m a big fan of Professor Jeremy Siegel, author and Professor of Finance at Wharton. From the market academics out there, he makes the most sense to me. He’s written a couple of books, including the classic “Stocks For the Long Run.”
In this excellent presentation, Professor Siegel explains some issues with the CAPE ratio. And interestingly, he’s a long-time close friend of its creator Robert Shiller. By the way, if you want to see the two of them duke it out, they debate whether stocks are too high here.
So what did Professor Siegel have to say about the CAPE ratio?
“There have been only 9 months since January 1991 when the CAPE ratio has been below its mean.
The CAPE ratio indicated the market was overvalued in May 2009, when the S&P 500 was at 919 (it’s now 2700).
Basically, over the last 30 years you’ve never been undervalued – except from a few months at the bottom of the worst bear market in 75 years. That looks strange to me.
It has called the market overvalued for the last 8-9 years and has been totally wrong.”
Why is this? What’s going on? Siegel studied market earnings to find out.
He noticed that Shiller’s paper on the CAPE ratio was released in 1996. Two years later, accounting rules were changed for company earnings, causing earnings to be understated in some cases, especially so during the GFC.
An example of this is where a company makes a cash profit of $100m. In the same year, it writes down the value of an asset it owns by $50m on paper. The company is forced to report an accounting profit of only $50m, even though underlying cash earnings were actually $100m.
Where there were huge write-downs during the GFC, this new rule distorted the appearance of company earnings, and therefore metrics like the CAPE ratio.
This would explain some of the bearishness of the CAPE ratio in recent years. And it should be noted that Warren Buffett also believes the new accounting rules are overly conservative. Buffett has even called the figures “useless” for analytical purposes.
Bottom line: the CAPE ratio has been saying the market is overvalued for quite a long time, and despite that the market has delivered pretty strong returns.
So how does Professor Siegel value the market? He uses the earnings yield.
The earnings yield is simply found by taking the PE ratio and flipping it over. A price-earnings ratio of 15 gives you an earnings yield of 6.66%. All you do is divide 100 by 15. 100/15 = 6.66%.
And Siegel points out that this is the best predictor of long term real returns. As it turns out, over the last 100+ years the long run PE ratio has been close to 15. So perhaps it’s no surprise that the long run real return from stocks for the US (and indeed Australia) has been about 6.5%.
That’s interesting. Today, the PE ratios of both markets sit higher than that. Closer to 20 in fact. What’s the reason for this? And does this mean markets are overpriced?
First, let’s look at what the current figures imply. If we take a PE ratio of 20, that implies a real return of 5%. That’s after inflation. Add inflation of 2% and we get a long term total return of 7% per annum.
That doesn’t seem too bad. Lower than history, but still pretty good. It certainly doesn’t match the hysteria that surrounds most chatter about the level of the market. But can the market maintain a higher PE ratio than the long term average? How is this sustainable?
One case put forward warranting a higher PE than the long run average is the cost of investing. More specifically, the rise of indexing and how easy and cheap it is for the average investor to buy a diversified portfolio of shares.
In the olden days, building a widely diversified portfolio was expensive, as you had to buy the stocks individually, or pay exorbitant entry fees just to access a high-fee managed fund.
So if long term real returns were 6.5% per annum, what were investors actually getting? Maybe 5%?
Now, the cost of investing is basically zero. Brokerage is incredibly cheap, and you can own every major listed company in an index fund for almost nothing.
So a higher PE could be sustained for investors to earn exactly the same return, after costs. Rather than a long term average of 15, this one factor alone could justify a new long term average PE of 20.
It’s also been posed that the sharemarket should be trading at a higher PE ratio than 100 years ago, as economies like the US and Australia have developed and become more stable over time.
The idea is that due to more data and information, economies have become a bit better managed, with the business cycle having less wild swings than it did during the early 1900s, before central banks were created.
This is obviously a contentious issue. Nobody feels like things are stable, and hanging shit on the government and central banks is a national sport in most developed countries.
Of course, we can all point to reasons why things aren’t as good as they might be. But overall, there has been no deep recessions and no mass unemployment for a very long time.
Inflation has been low and stable. Interest rates have been low and stable. Wages have still been growing quicker than inflation. And technology is slowly improving things, with new conveniences, opportunities and breakthroughs in medicine that we never imagined.
Australia and the US are part of the extremely wealthy developed world and things move a bit smoother than they used to. So the idea is, investing is a little less risky than it was 100 years ago, and slightly higher valuations are not unreasonable. I think there is some merit to this idea, but I’m not totally convinced.
One major reason why many asset prices around the world are high, is low interest rates. Low interest rates make cash investments like term deposits and bonds less attractive to own. Therefore it encourages more money to go into higher returning assets like shares and property.
Essentially, interest rates tell you the return you’re going to get for taking no risk. Currently, a term deposit at a large bank might earn you a bit under 2%.
After inflation, this return is essentially zero. And that’s before tax. So in today’s world, you take no risk, you get no return.
In comparison, other asset classes look much more attractive in a low interest rate environment. Interest rates around the world are about as low as they’ve ever been, in an attempt to boost economic growth, among other reasons. Some countries even have negative interest rates, which is another topic entirely!
Again, yields on term deposits and bonds are so low that long term returns are likely to be poor.
Why? Because the best predictor of long term returns on bonds is the starting yield. That’s why bonds have had great returns over the last few decades. Interest rates and yields were very high back then.
So the outlook for bonds and cash isn’t very good, but both will continue to provide a cushion against volatility, if you’re into that sort of thing. How do these options – taking risk vs taking no risk – compare right now?
The difference between the return of shares and safer assets like bonds is called the equity risk premium (the estimated premium you’ll earn for the risk of investing in equities).
So, with yields on bonds and cash around 1-2%, we could expect to earn a long term real return of around zero.
With a current sharemarket PE ratio of 18 in Australia – an earnings yield of 5.5% – we can probably expect a long term real return of around 5.5%. Remember, long term real returns are typically in line with the earnings yield, as Jeremy Siegel shows here.
The above numbers imply that we can expect to earn an equity risk premium of 5.5% per year. Is this good? How does it compare to history?
Well, the RBA notes that in Australia the long term equity risk premium is around 4%.
This means, compared to safer assets, stocks are actually more attractively priced than the long run averages. Based on current valuations, taking sharemarket risk should be handsomely rewarded over the long term.
And in Australia, franking credits are an extra boost, meaning the compensation for taking risk is even higher. Even if you want to be conservative and assume a drop in earnings to account for the business cycle, markets still seem reasonably priced, given there is plenty of fear and risk aversion around.
With interest rates so low, there is likely a huge opportunity cost for holding more cash than your situation demands. Of course, the next argument goes, “when interest rates return to more ‘normal’ levels, this will all be over.”
I won’t make any forecasts here for two reasons. It’s way above my pay-grade and brain capacity. And nobody can tell you exactly what interest rates will do over the next 30 years.
Interest rates around the globe have been pretty low since 2008-09. Economies have recovered since the GFC, but they’re hardly flying. As such, central banks aren’t able to increase rates much, if at all. In fact, a number of countries are now cutting interest rates as the global economy has slowed.
So it doesn’t look like rates will be heading higher in the short term. Well, what about the medium to long term?
We can look to long term bond yields to get a hint for what markets believe interest rates will do over the next few decades.
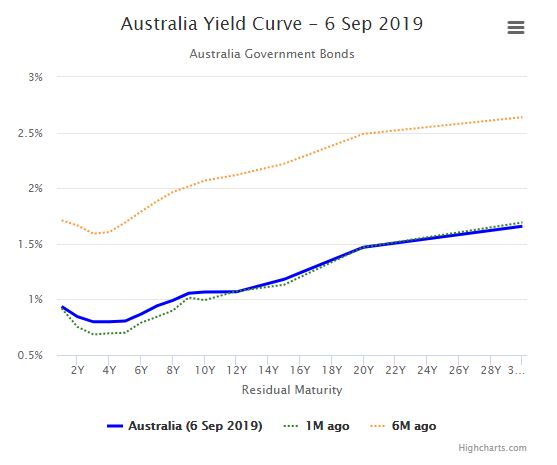
As we can see, long term bond yields today (blue line) have come way down from only a year ago (brown line). This implies that the expectation for inflation and long term interest rates is also lower than before. And that rates are likely headed lower in the next couple of years.
What does this mean for the sharemarket?
Well, as always, anything can happen in the short run. But given the current level of interest rates, and that rates are expected to remain very low for a long time, this reinforces the point above that stocks are more attractively priced than many think.
Add to that, the earlier points about the ease and near-zero cost of index funds. Under these conditions, paying 20 times earnings (5% earnings yield) for stocks certainly doesn’t seem unreasonable.
Warren Buffett has mentioned a few times that if rates stay low, then stocks are cheap. And Jeremy Siegel also said this on valuations and interest rates;
“Given how low interest rates are, stocks are really pretty cheap. The market is not overvalued on any sort of long term basis.”
Given the information we have, the notion that stocks are dangerously overvalued seems a bit far-fetched. Instead, markets seem to be somewhere between reasonable value and fairly attractive.
The advice for us to be cautious is well meaning. And the worry surrounding a possible recession is fair. But it doesn’t make sense to spend all your time worrying about it.
One day we will have a proper downturn and it won’t feel good. By the way, I have no idea when that will be or what it will look like. In any case, your regular saving and investing will ensure you’re taking advantage of the lower share prices on offer.
That means as the market recovers, like it always does, you’ll come out the other side in an even stronger financial position than before. But you have to sit through the short term pain to get the long term gains.
Luckily that involves simply sticking to your plan and continuing to buy shares in a large basket of companies, reinvesting your dividends, and getting on with building your ideal life.
I usually try and keep it pretty simple around here. So hopefully covering this endlessly-discussed topic didn’t break that principle!
My view: the sharemarket is not overvalued. I’m not saying it won’t fall – who would argue that? It definitely will at some point. What I’m saying is, shares look attractively priced compared to the alternatives. And that safer options offer very poor long term returns from here.
The best long term returns will be had by those that continue to buy diversified assets which produce growing income streams over time.
Most important of all, if you’re building a portfolio to reach Financial Independence, you should focus on exactly that… building the portfolio!
And that’s not done through watching, waiting or worrying!
So keep your head down and ignore the news (it’s not education, it’s entertainment). Focus on your personal goals. And remember, the future is bright.
The life skills you’re building – like good money management, adaptability, and living with a feeling of gratitude for our already-great place in the world, will ensure you’ll be perfectly fine whatever happens along the way.
***Nothing here is advice. These are the opinions of one random blogger. Please make your own investment decisions. I leaned heavily on the works of Jeremy Siegel and Ben Carlson in forming my views on this topic. Credit goes to both – these guys make the most sense to me.
Learn how our EV performed on our recent roadtrip and holiday in Southwest WA. What I learned from the experience, plus lots of pictures, recommended places to eat, and more 😉
The numbers behind our recent solar installation and how much we’ll save. A breakdown of solar FAQ, whether it’s a good investment and what to watch out for.


Get my latest content and thoughts straight to your inbox.
A fresh dose of financial motivation to power your journey.


This is an article after my own heart, Dave, with excellent links to Siegal and the debate, thanks, I hadn’ seen that. I broadly agree with the overall position, and especially the advice to not try to time the market and invest over the long-term if you’re in the accumulation stage.
One perspective bring out though, is that it is not so obvious which is correct about the future, the equity or bond markets. In some senses they could be seen to be in a tussle over the expected state of the world going forward. This can mean that while in the short term low or lower rates can be “good” for equity, if bond rates are lower because they are signalling expected poor conditions ahead, then this can be a headwind for equity.
I was just discussing this quite related article with HiFIRE actually, that offers a different perspective. It points out that:
“Here’s an unpleasant full-cycle calculation. Within the 80-year period from 1929 to 2009, the S&P 500 took three long, interesting trips to nowhere, accounting for 53 of those years (1929-1945, 1959-1982, and 1995-2009), underperforming risk-free Treasury bills after all was said and done.” (https://www.hussmanfunds.com/comment/mc190906/)
I haven’t really seen any claims that Australia is dangerously over-valued, for the sound reasons you give, but perhaps if there’s a caution, it should be that equity market records feature extended periods of underperformance, lasting longer than many FI seekers intended accumulation periods. This should be squarely in front of people’s eyes as they invest, lest they mistake their actual risk tolerance.
Thanks very much for the thoughtful comment! Good points in there.
It can of course be argued that low rates indicate a poor outlook and vice versa – my line of thinking was really that it’s normal for markets to trade at higher valuations during periods of low rates, as Siegel points out. It seems people suggest low/high interest rates mean good/bad outlook, depending on their existing personal view (likely myself included) lol.
I guess the bottom line is, as always, nobody knows! That’s part of the fun I guess!
While it’s totally true that there are long periods of poor performance – Australia had a crap ten year period from 2007-2017 – I don’t really see much value in looking at the markets this way. Cherry-picking start and end dates (while interesting) isn’t really useful, as buying a large lump all at once, leaving it there and never adding more is almost nobody’s experience. Using this calculator, even if somebody bought in 1995 and did nothing but reinvest their dividends till 2009, they still earned a return of 6.16% per annum – and this covers two market crashes. Likewise, 1959 to 1982 with reinvested dividends shows a return a bit higher than that. I didn’t test the other dates. Hardly terrible, but the point of poor returns compared to a risk-free option is fair.
I’d like to see an example of an investor who was adding to a portfolio regularly over that time and how they fared. That’d match up a bit better with real-world experience. Also it’s probably important to note that while anything can happen, the majority of an FI portfolio over 5-15 years is built through savings rather than investment returns.
I liked the blog post Dave very comprehensive and also the perspective that FI explorer thrown in. I tried playing around with the calculator with those 3 long lean periods.
The first two if we adjust for inflation there is not much real return at all? It’s relevant for those planning on FIRE to keep in the back of one’s mind. It is common for say someone in their early 20s to plug in 4 or 5% real returns for say the next 15 years to forecast a FIRE date. It just means it is worth considering what very small returns would do to your plans.
After all 3 very long periods in the US stock market in the last century has already seen this occur. I think the third period discussed was still over 3% real though which is not so bad. Although if you started ploughing into vanguard S&P500 in 2000 in your early 20s to reach FIRE what are the odds that person would be maintaining the discipline come 2009? One in ten maybe?
As you mentioned these discussions are often with a dose of cherry picking dates of which my post here is also guilty off! 🙂
I find discussions on CAPE centre around a choice of example stay in US equities, or go to cash and time the market instead. Possibly because there is not as much long term data on other global markets?
In this respect I’ve always found this below article an interesting read on the topic. For example if the US CAPE is seriously high perhaps more should be invested in other global markets where that isn’t the case? In hindsight the CAPE was huge in Japan in the late 80s and it was wise to avoid, despite plunging interest rates later. You didn’t need to go to cash though, just seek other global stock markets.
Here is the link anyway..
https://mebfaber.com/2019/01/06/you-would-have-missed-961-in-gains-using-the-cape-ratio-and-thats-a-good-thing/
After all that rambling perhaps the key message is to be wary of going “all in” and limiting your investing to one country’s stock market? The long lean patches don’t seem to be as prevalent if you diversify.
Cheers
Steve.
Hey Steve, thanks for sharing your thoughts on this!
I suppose the thing is we have to make some assumptions on returns, and of course accept that it may not turn out as well as we hope. That article is interesting. The deeper you go into it, the more muddy it becomes – for me anyway!
I think you summed it up really well, that diversification is perhaps the only real thing that comes close to avoiding a potentially bad outcome. And that it makes sense to look at other markets for value rather than assuming the only alternative is to hold cash.
Thanks again mate – now my head hurts so it must be time for a lie down lol 🙂
Wow, 53/80 years – more than I thought!
The calculations in this article are not as well detailed as the one you linked FIE, but I think it adds decent value to the debate: https://awealthofcommonsense.com/2014/02/worlds-worst-market-timer/
I think the most useful insight from the article in relation to this convo is that an investor who dollar-cost averaged ended up with +2x more than an investor who invested just before every market crash (and never sold) – i.e. incremental accumulation removes a significant amount of the risk of ‘interesting trips to nowhere’ (great phrase), especially when the investor is in the early stages.
I think you both might like one of the lines in the disclaimer too – “It takes nerves of steel to hold 100% of your portfolio in stocks for decades on end.”
Another old gem from Ben’s blog, forgot about that one. Thanks for sharing.
As per my earlier comment, I totally agree with that insight – a dollar-cost averaging scenario makes more sense than simply one date to another, as that more closely resembles an investor’s actual experience.
Easy choice really, stay scared of high valuations and keep your money in the bank earning nothing
or put it to work in the market and in my case earning income through dividends.
Low interest rates are here to stay for a while and will probably get lower maybe even going to the negative as seen in some overseas countries and thats going to contribute to higher valuations as you suggested. Investing comes with pain and riding the bumps, IMO diversification and getting your portfolio balanced is what its all about and sticking with Blue Chip companies, LIC’s,ETFs that will continue to make money in all market conditions and that are less volatile than norm.
Those who want to look for glory stocks that are aiming for the moon then strap your self in because
its going to get rough sooner than later. Common sense as much as the Shiller PE etc tells you that…
Dave….been meaning to ask, you dont seem to contribute to Motley Fool anymore, Scotty didnt like your free income based stock reviews clashing with his not so free everlasting approach?…joking!!
Totally agree Mark. We can’t know what will happen but it seems likely that rate cuts/stimulus is coming and likely to help support company earnings/valuations. Continuing to invest makes the most sense – especially considering the dividend streams on offer are still very attractive! 🙂
Oh stopped doing Fool articles as I decided I’d rather spend more time on this blog, working on new articles and replying to readers. Also was losing interest in direct stocks and prefer the simple LICs and index fund route!
Nice article Dave, reaffirmed a lot of my thoughts lately. I do tend to see myself keeping more cash at the moment (min 10% of portfolio) to buy into opportunities when dips are presented, considering the current emotion is high. You just have to follow Trumps twitter account to provide enough insight to what the market will do on the short term! As long term investors it’s easy to cut out the noise and huge declines should only be seen as opportunities. I wouldn’t welcome a recession, as many jobs in my company would be lost if one happened, but a ‘correction’ in our markets to lower the PE of many great companies I follow would be more than welcome.
Thanks for sharing your approach Ben. I’d also welcome lower prices as we continue to build our portfolio – but that’s likely to come alongside some economic issues which aren’t so nice. Haha I don’t follow Trumps twitter, or anyone’s really. I try to ignore as much of the news/noise as humanly possible, and find it really enjoyable!
Thanks for this excellent article, and I really enjoyed learning about the simple approach to using the inverse of PE ratio + inflation as the expected total return, as I’d never thought about it that way.
Using the benefit of hindsight, it seems that everyone should have seen the 2008 sharemarket crash coming based on the high PE on US stocks. How would you approach investing for FI during a “boom” time where the PE ratio is climbing to ridiculous levels (such as 30 and above)? I have to admit I’d be more cautious, and still buy some parcels of shares, but keep more cash than usual to try to take advantage of a crash.
Cheers Julian. Hmm, it’s hard to answer that question! If I had a home loan perhaps I’d be using money to pay down debt for a more attractive and reliable return, if the market PE was really high.
Other than that I’m not sure how much cash I’d keep… probably not much – maybe a little bit more than normal. Market booms and busts can go on much longer than we expect, and when the downturn finally came you’d still have your employment income and a healthy flow of dividends coming in to scoop up shares at lower prices. Then again maybe my approach would be different when faced with that in real life!
These posts are really great. You’re not over-doing anything. Love your objective non-emo view. Scott
I appreciate that Scott, thanks!
What…no mention of the inverted Yield curve :o)
Great post as always and an enjoyable read
CAPE for Australia according to Schiller is currently 19.8
NZ is 29.4
Ireland is 52.1
Haha nope, would’ve lost everyone by talking about that I think – including myself lol. Didn’t know those figures Baz, thanks for sharing!
I find your article way way above what most financial media have been accustoming us to lately. Very interesting explanation of the current overvaluation in the share market compared to historical averages. In particular, the risk premium of equity relative to the cash rate and the rise of passive indexation are likely to be some massive influencers.
I find actually some reassurance in the meaningfulness of using stocks for long term wealth building in the work of Piketty (who would have guessed!). You can indeed infer from his work that the equities (i.e money invested in businesses) risk premium has been around 5% for centuries prior to the industrial revolution.
So by all means, it provides a high level of certainty that, even though our current world does not benefit anymore from the combined tailwinds of high population growth, increased interconnectivity of the world and benign environmental impact of the human activity on the environment, investing in equity should remain a superior investment compared to cash or government bonds (and maybe gold, although it is less clear if money printing is required to avoid a deflation).
Cheers David, interesting comment!
It’s pretty hard to have any real useful takeaways from most financial media these days – it’s designed for clicks, nothing else. That’s why I mostly avoid it.
Well put – although the short term is uncertain as always, long term investors should still be well rewarded. Personally, I wouldn’t consider gold as an investment, regardless of its price or prospects. Only productive income-generating assets make the cut around here 🙂
Great article Dave. Your anti-hysteria lens is fun to be around. Cheers also for the lesson in P/E history – I had no idea. It would make sense to me that changing these rules are also a contributing factor to sustained higher P/E ratios.
Haha thanks Kurt! I do try to restore a little balance to the conversation 🙂
As you say, it is best to ignore the finance commentary in the media.
Yesterday I happened to hear a finance expert being interviewed on the radio. She said that she recommends that people reduce their exposure to Australian shares because a recession is imminent. She said that people close to retirement should get out of the Aussie sharemarket altogether. I couldn’t believe my ears.
I liken my share investments as businesses (and that’s what they really are). My neighbour runs a building-supplies business; would this finance expert recommend that my neighbour sell his business?
And if I took this expert’s advice and sell all my shares, who will pay me those sweet sweet fully-franked dividends?
Haha good example Robert! It’s especially scary when you consider that people approaching retirement could potentially need to generate income for another 30 years! That won’t turn out well with bank interest providing 1.5% with no growth. Jeez! And I’m assuming this ‘expert’ is going to tell these retirees when to jump back in when shares are cheap again?
Man it’s so dangerous for people to listen to so-called experts. Like you said these are businesses generating real profits and dividends to shareholders, that’s going to continue regardless of a possible recession or two over the next few decades.
Well thought out article, would be interested to hear your thoughts on the following blog post:
http://petewargent.blogspot.com/2019/09/emerging-markets.html
I greatly respect Pete and his writings first of all. His going to 50% cash appears a bit out of character, as when I interviewed him he was ‘accumulating on all fronts’, so I’m not sure – maybe he means his equities portfolio is 50% cash right now?
I don’t agree with the approach of timing cycles, most people have absolutely no capacity to do that and it’s largely a waste of time/effort in my view. I’m not saying markets will continue to go up (Pete and his business partner might be spot on), but I suppose I just can’t get behind trying to time the market, especially for myself and readers of this blog who are building long term portfolios to become financially independent with a goal to living off the income from that portfolio. But everyone has different goals, so to each to their own! 🙂